Your team runs an internal accuracy evaluation on the transcript pipeline. The headline number comes back at roughly 5% WER. Comfortable. Defensible. You sign off.
But buried in that same evaluation dataset are segments where the ASR model fabricated a complete phrase during a 12-second silence in an earnings Q&A. Another segment contains a ticker-like entity that never appeared in the audio. A third swapped a reported revenue figure for a plausible but entirely wrong number. None of those failures moved the WER needle in any meaningful way. The metric told you the system was performing well. The system was hallucinating.
This isn’t a theoretical concern. AI hallucinations in financial transcripts are now a measurable, systematically studied phenomenon. The published benchmark literature (Careless Whisper, Earnings-21, and recent work on non-speech-induced hallucinations) quantifies exactly where and how often modern ASR systems fabricate content. And the pattern it reveals should matter to every Head of Data and Head of Engineering running a financial transcript operation: the tokens your downstream analytics depend on most (entity names, numerical figures, ticker symbols) are precisely the tokens these models get wrong most often.
The core problem isn’t that ASR accuracy is bad in some general sense. It’s that the industry’s standard evaluation metric systematically undercounts the failures that actually break things. A hallucinated sentence that’s grammatically fluent scores fine on perplexity. A fabricated phrase during silence doesn’t register as a substitution error. WER was designed to measure one thing. Financial data platforms need to measure something different.
What follows is a walk through what the benchmark data actually shows, why conventional accuracy frameworks miss the failure modes that matter for finance, and what metrics deserve a place in your vendor evaluation instead. No alarmism. Just the numbers, and what they mean for your pipeline.
Defining ASR Hallucinations in Financial Audio: What Counts and What Doesn’t
Not every transcription error is a hallucination. The distinction matters because the mitigation strategies are completely different, and conflating the two leads to evaluation frameworks that miss the most dangerous failures.
Standard ASR errors fall into three familiar categories: substitutions, deletions, and insertions. These are phonetically motivated. The model mishears “Barclays” as “bar clays” or drops a filler word. The output is wrong, but it’s wrong in a way that traces back to the acoustic signal. You can usually spot the phonetic logic, even if the result is incorrect.
Hallucinations are structurally different. Following the definition established by Koenecke et al. in the Careless Whisper study (2024), a hallucination is a prediction with no phonetic or semantic connection to the reference audio. The model doesn’t mishear something. It invents something. The output text is fluent, grammatically coherent, and entirely fabricated.
How Language Model Priors Override Acoustic Evidence
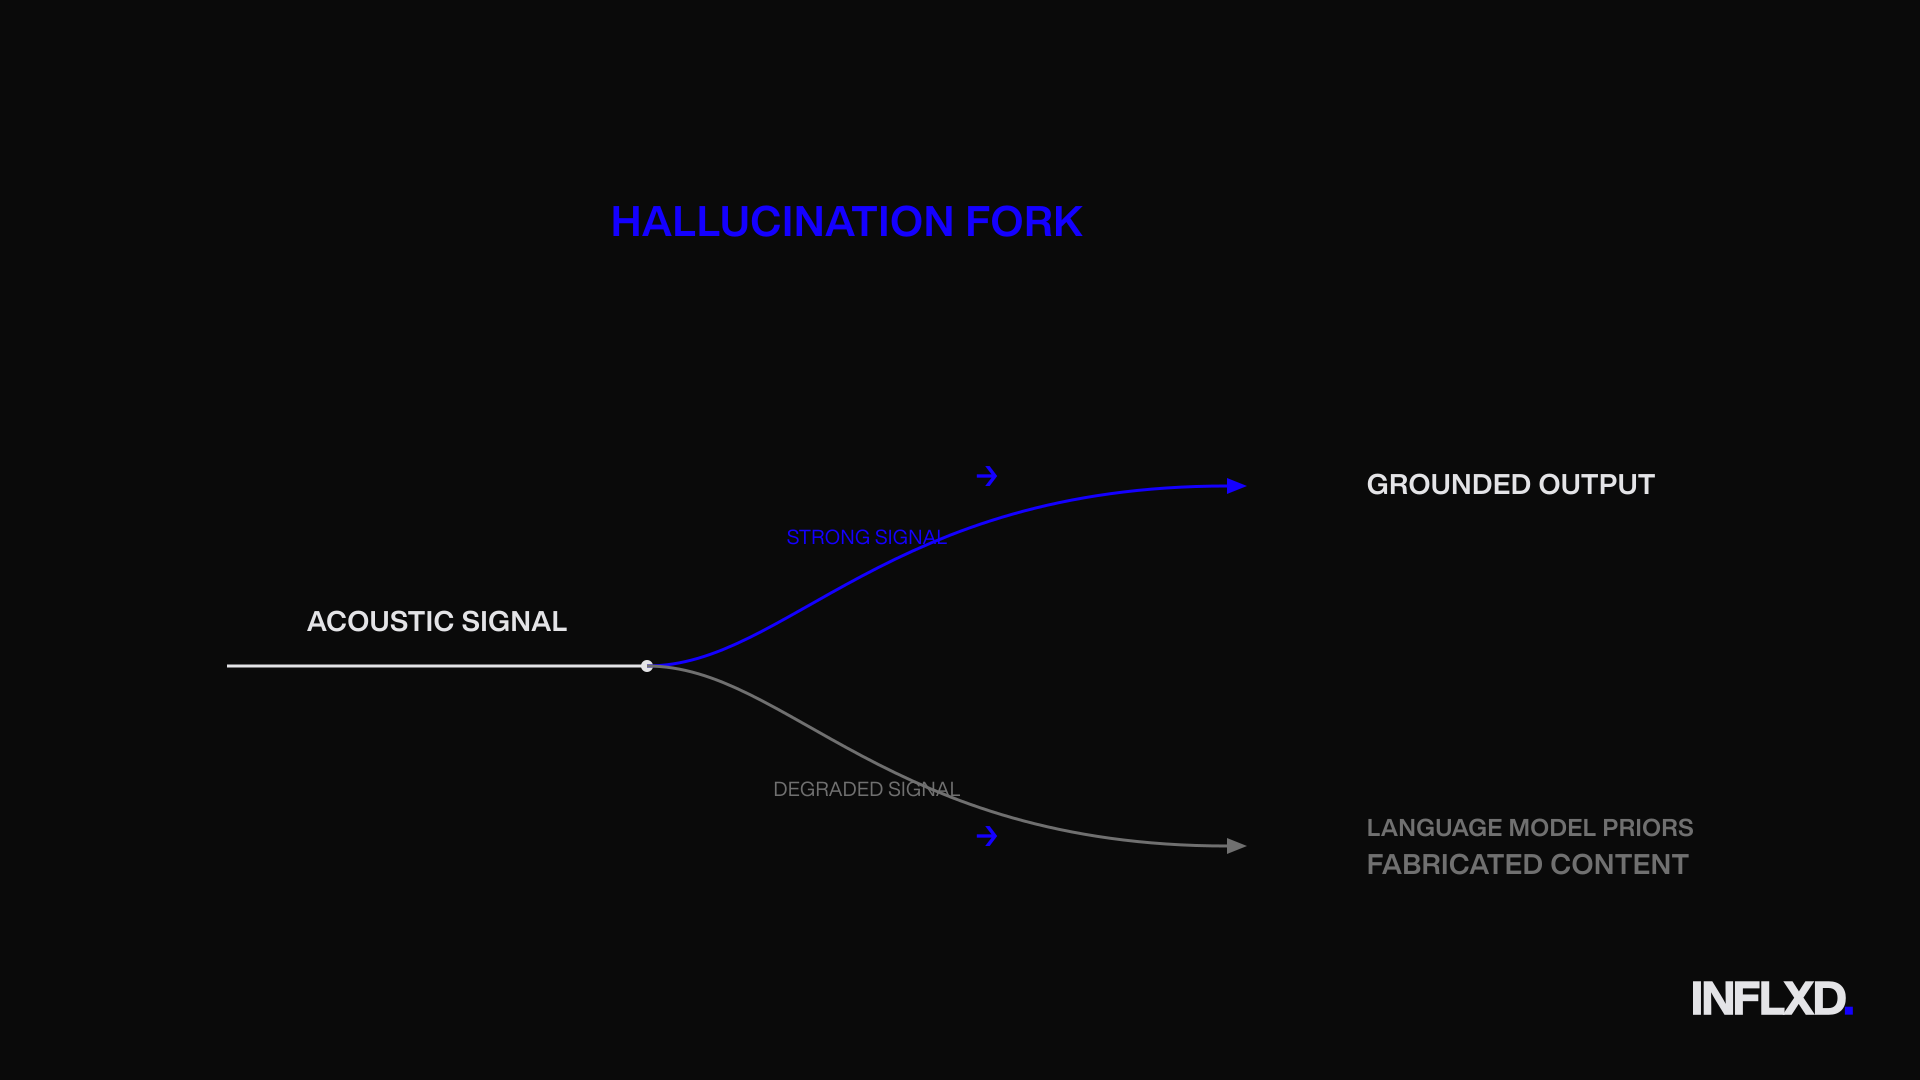
Understanding why this happens requires a brief look at how modern ASR models work. Systems like Whisper use an encoder-decoder architecture. In plain terms: one component (the encoder) processes the raw audio signal, and a second component (the decoder) generates text based on what the encoder found. That decoder is essentially a language model. It’s been trained on enormous volumes of text data, which means it has strong priors about what plausible sentences look like.
When the acoustic signal is clear and strong, the encoder provides enough evidence to keep the decoder honest. The language model fills in minor gaps, smooths output, and the result is accurate. But when the acoustic signal degrades or disappears entirely, the balance shifts. The decoder’s language model priors take over, and it generates text that sounds right but isn’t grounded in any actual speech. This is the hallucination mechanism.
It’s worth emphasizing: this isn’t a bug unique to any single vendor or model. It’s a structural property of encoder-decoder ASR systems with strong language model components. Any model in this family is susceptible under the right (or rather, wrong) conditions.
Why Financial Audio Is Particularly Vulnerable
Most hallucination research to date has concentrated on clinical and medical contexts, where Whisper was found to fabricate dialogue in recordings of patients with speech disfluencies. That work raised important alarms. But the conditions that trigger hallucinations in medical audio exist in financial audio too, often in concentrated form.
Three factors make financial recordings especially prone to hallucination:
- Silence and extended pauses. Earnings Q&A sessions and expert network calls routinely contain long pauses as speakers consider questions, wait for follow-ups, or defer to colleagues. These non-vocal segments are precisely the conditions the Careless Whisper study identified as hallucination triggers. The model encounters silence, and the decoder fills it with plausible-sounding language.
- Disfluency patterns. Financial professionals speaking extemporaneously (particularly in expert interviews) produce false starts, hedging language, and mid-sentence corrections. These low-confidence acoustic segments weaken the encoder’s signal and give the language model room to override what’s actually being said.
- Domain shift from training data. General-purpose ASR models are trained on broad datasets that underrepresent financial terminology. Ticker symbols, fund names, structured product labels, and sector-specific jargon sit outside the model’s training distribution. When the encoder produces ambiguous representations for these tokens, the decoder defaults to its priors, substituting common-vocabulary alternatives that are fluent but wrong.
The result is a category of error that’s invisible to standard evaluation. A hallucinated phrase during a pause doesn’t show up as a substitution because there’s no reference word to substitute against. A fabricated sentence that reads naturally won’t flag on any fluency-based quality check. And a plausible-but-wrong entity name looks perfectly fine until someone tries to use it in a downstream model.
This is the gap that the rest of this piece quantifies. The benchmark data shows where these failures cluster, how often they occur, and why WER alone can’t catch them.
Hallucination Rate in Speech-to-Text Systems: What the Careless Whisper Data Shows
The most rigorous public study on ASR hallucination rates comes from Koenecke et al., published at ACM FAccT 2024. The Careless Whisper paper tested 13,140 audio segments through OpenAI’s Whisper and found that 187 segments reliably produced hallucinated output. That’s content with no phonetic or semantic connection to the underlying audio. Across two separate transcription runs in April and May 2023, the researchers identified 312 hallucinated transcriptions total, yielding an average hallucination rate of approximately 1.4% at the segment level.
A 1.4% rate sounds small. It isn’t.
The Harm Taxonomy: What Hallucinated Content Actually Contains
The Careless Whisper researchers didn’t stop at counting hallucinations. They coded the fabricated content for harm categories, and the results are striking. Of all hallucinations identified, 38% contained at least one category of explicit harm:
- 19% perpetuated violence in the fabricated text.
- 13% contained inaccurate associations, including made-up names, locations, or relationships that didn’t exist in the audio.
- 8% asserted false authority, generating language patterns like YouTuber-style sign-offs or fabricated URLs.
For financial data platforms, the “inaccurate associations” category deserves particular attention. A model that invents names, locations, or relationships during silence is doing exactly the kind of damage that corrupts entity-linked datasets. The fabricated content isn’t random noise. It’s fluent, plausible, and structured in a way that downstream systems will ingest without complaint.
Non-Determinism: Why You Can’t Pattern-Match Your Way Out
One of the study’s most important findings is that hallucinations are non-deterministic. The same audio segment produced different hallucinated text on successive runs. This means you can’t build a simple blocklist of known hallucination strings and filter them out. The fabricated content changes each time the model processes the same input.
This property makes hallucinations fundamentally harder to catch than standard ASR errors. A consistent substitution error (the model always mishears “Barclays” as “bar clays”) can be addressed with post-processing rules or custom vocabulary. A hallucination that generates different fabricated text on every pass requires a different detection strategy entirely.
Scaling the Rate to Production Volumes
Here’s where the math matters for financial data operations. Consider a platform processing 5,000 calls per quarter, each producing roughly 200 transcription segments. That’s 1,000,000 segments per quarter. At a 1.4% hallucination rate, you’re looking at approximately 14,000 segments containing fabricated content every quarter. Even at the lower bound of the study’s range (closer to 1%), that’s still 10,000 segments per quarter with content the speaker never said.
These aren’t edge cases. They’re a systematic feature of the transcription vendor ecosystem’s reliance on general-purpose ASR models that weren’t built for the accuracy demands of financial data.
The December 2023 Update: Progress, Not Resolution
The Careless Whisper study included a follow-up test after a Whisper model update in December 2023. Of the 187 segments that had reliably produced hallucinations, 12 still hallucinated after the update. That’s a significant reduction, and it signals that the broader ASR industry is treating hallucinations as a real engineering problem.
But “significant reduction” isn’t elimination. And the follow-up only tested previously known hallucinating segments. It doesn’t tell us whether new hallucination patterns emerged in segments that were clean before the update. The trajectory is positive. The problem is not solved.
For Heads of Data and Engineering evaluating speech-to-text accuracy in financial transcription pipelines, the Careless Whisper data establishes a critical baseline: hallucination isn’t a theoretical risk. It’s a measured phenomenon with a quantified rate, a documented harm profile, and a non-deterministic behavior pattern that resists simple mitigation. The question isn’t whether your transcription vendors are producing hallucinated content. It’s whether your evaluation framework is designed to find it.
Why Transcription Accuracy Rates Are Misleading for Financial Data Platforms
WER is the industry’s default metric for evaluating transcription quality. It’s also the metric most likely to give you false confidence when the failure mode you should care about is hallucination.
The formula is straightforward: (substitutions + deletions + insertions) divided by total reference words. A 5% WER means that for every 100 words in the reference transcript, the ASR output contains five token-level mismatches. It’s a useful measure of general transcription fidelity. But it treats every error as equal. A phonetic substitution (“fifteen” for “fifty”) and a fully fabricated sentence both register as token-level mismatches. WER doesn’t distinguish between a model that mishears and a model that invents.
That distinction is the whole game for financial data platforms. A phonetic error is recoverable. A downstream NLP system or a human analyst can often infer the correct word from context. A hallucinated sentence containing a fabricated entity name, a made-up revenue figure, or a plausible but nonexistent product label isn’t recoverable in the same way. It’s structurally indistinguishable from real content. Yet both error types contribute identically to the WER calculation.
Atwany et al. put this precisely in the Lost in Transcription paper (2025): “High WERs can mask low hallucination rates, while low WERs may conceal dangerous hallucinations.” A model that produces sloppy phonetic errors throughout a transcript will report a high WER but may never hallucinate. A model that’s phonetically precise 99% of the time but fabricates entire phrases during silence can report a low WER while injecting fabricated content into your dataset. As Koenecke et al. confirmed in the Careless Whisper study, WER “cannot differentiate between hallucinatory and non-hallucinatory models.”
If your vendor evaluation relies on WER alone, you’re measuring the wrong axis of risk.
The Perplexity Trap: When Fluent Output Is the Problem
Many QA processes include a secondary check beyond WER: does the output text look reasonable? This often takes the form of language model perplexity scoring, where lower perplexity indicates more fluent, more “natural” text. It’s a sensible heuristic for catching garbled output. It’s also completely blind to hallucinations.
Here’s why. A hallucinated sentence is, by definition, generated by a language model. It’s fluent because fluency is what language models optimize for. When Whisper fabricates “Thank you for watching” at the end of an earnings call segment, that phrase scores excellently on perplexity. It’s grammatically correct, semantically coherent, and stylistically plausible. It’s also entirely fabricated. No one said it.
This creates a compounding problem for financial data platforms. The first layer of defense (WER) doesn’t flag the hallucination because the fabricated tokens may not significantly move the aggregate score. The second layer (fluency or perplexity checks) doesn’t flag it because the hallucinated content is more fluent than real speech, which contains disfluencies, false starts, and domain jargon that actually raises perplexity. The hallucination passes both gates cleanly.
Standard QA workflows built around “does this transcript look right?” will systematically miss the failure mode that matters most. The fabricated content doesn’t look wrong. That’s the entire problem.
Hallucination Error Rate: A Metric Built for the Actual Risk
The Lost in Transcription paper (Atwany et al., 2025) proposes a complementary metric that directly addresses this gap: Hallucination Error Rate (HER). It’s defined as the ratio of hallucination errors to total examples evaluated. Unlike WER, HER isolates fabricated content from phonetic errors, giving you a direct measure of how often the model invents rather than mishears.
The paper’s most actionable finding for financial data teams is this: distribution shift from training data to target domain correlates strongly with HER, with a reported correlation coefficient of α=0.91. In practical terms, the further your audio diverges from what the ASR model was trained on, the more hallucinations you’ll see. Financial audio (with its specialized vocabulary, entity density, and distinctive pause patterns) diverges significantly from the broad datasets most general-purpose ASR models train on. The correlation isn’t subtle. It’s nearly linear.
This means hallucination rates for financial transcripts aren’t random. They’re predictable based on how poorly the transcription vendor’s model fits the domain. And it means that a vendor reporting strong WER numbers on general benchmarks may be systematically underperforming on the specific dimension that matters for your use case.
The implication for financial data platform teams is direct. If your vendor reports only WER, you have no visibility into what fraction of errors are fabricated content versus phonetic mistakes. You can’t assess whether your pipeline is producing transcripts with recoverable errors or transcripts with silently injected fiction. These are categorically different failure modes with categorically different consequences for downstream analytics. Measuring one without the other isn’t a conservative evaluation approach. It’s an incomplete one.
Entity-Level ASR Accuracy on Earnings Calls: The Earnings-21 Benchmark
The previous sections established that WER undercounts hallucinations and that fluency-based QA can’t catch them. But there’s a separate, equally important dimension where headline WER misleads: entity-level accuracy. And for financial data platforms whose downstream pipelines extract company names, executive names, and financial figures from transcripts, this is where the numbers get uncomfortable.
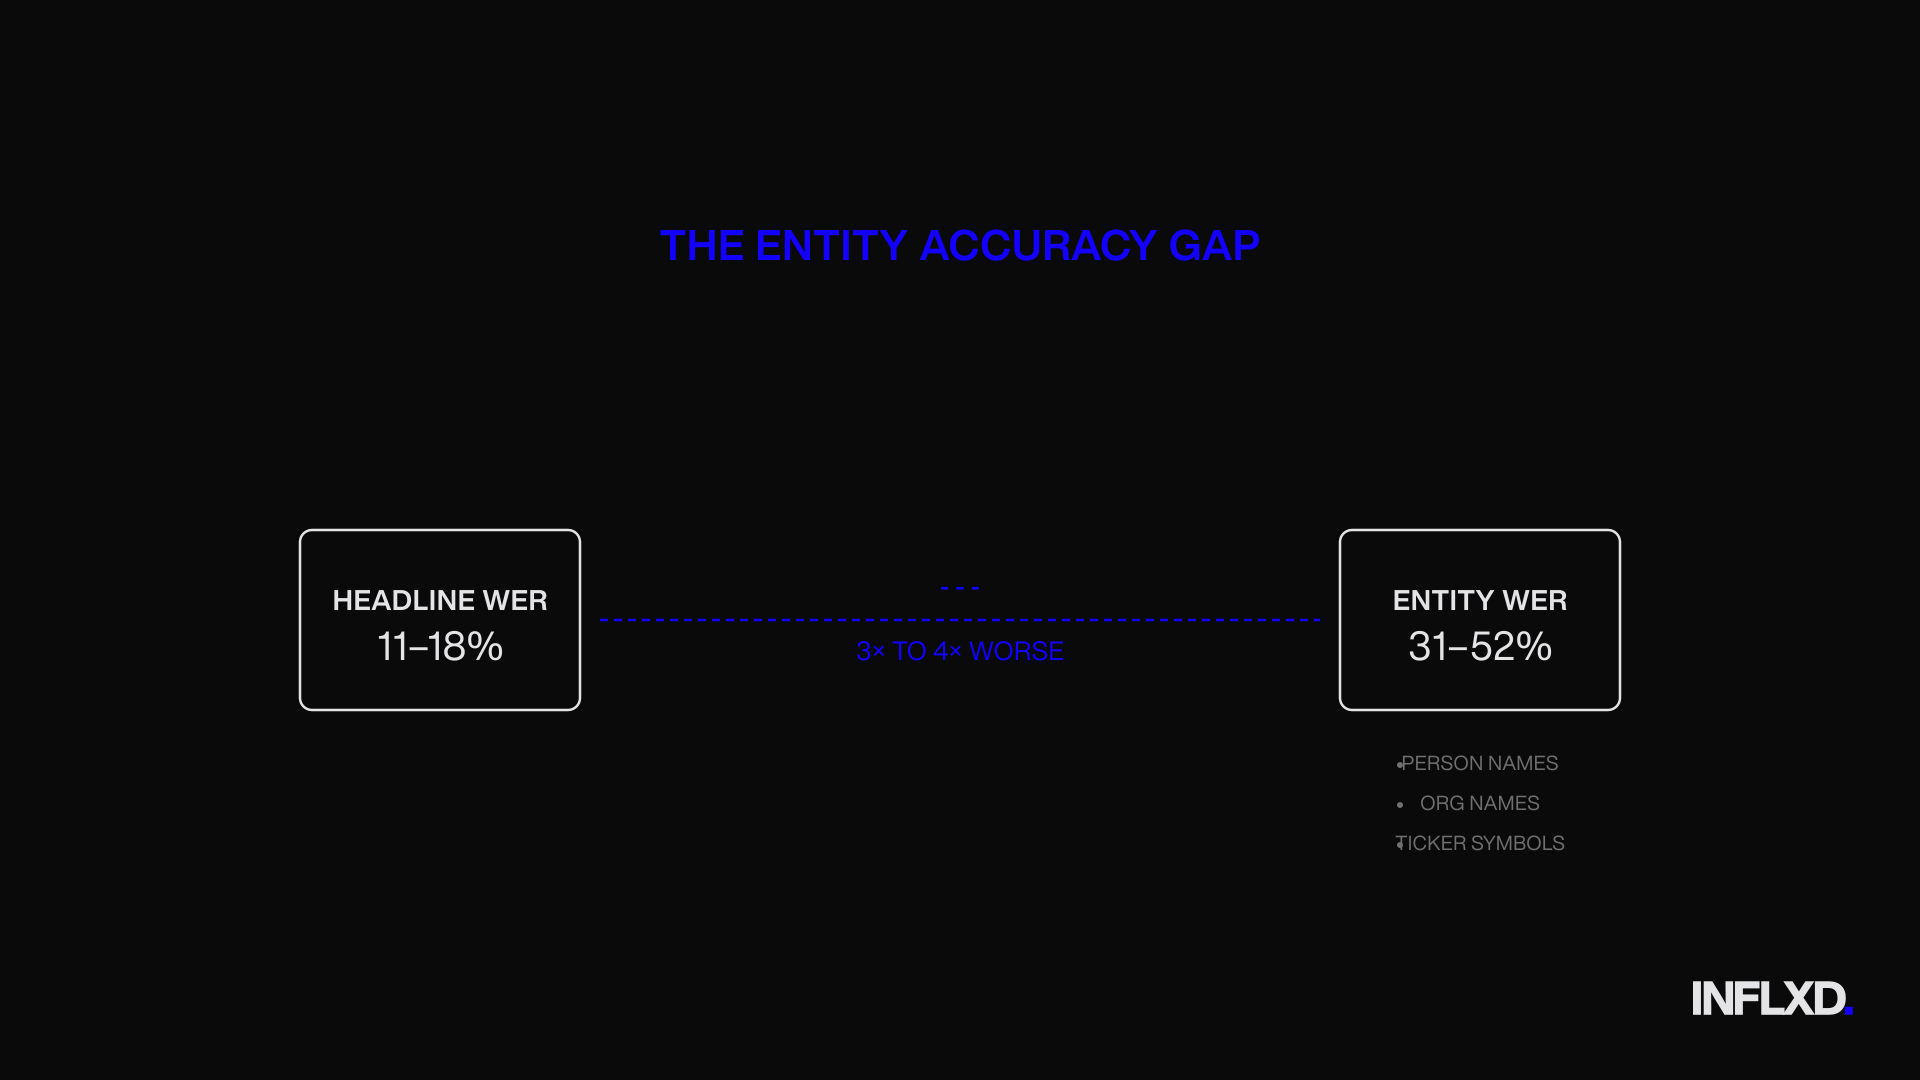
The Earnings-21 benchmark (Del Rio et al., 2021) provides the most granular public data on how ASR models perform on actual earnings call audio. The dataset spans 39 earnings calls across multiple sectors, and the researchers didn’t just measure aggregate WER. They broke accuracy down by named entity type. The gap between headline performance and entity-specific performance is severe.
Across the models tested, headline WER ranged from 11.3% to 17.8%. Respectable numbers for spontaneous financial speech. But when you isolate the tokens that fall within named entity spans, the picture changes dramatically. PERSON entity WER ranged from 42.1% to 51.7%. ORG entity WER ranged from 31.4% to 44.3%. FAC (facility names) ranged from 34.8% to 44.1%. Entity-level error rates are 2x to 4x worse than the headline WER reported for the same models on the same audio.
Contrast those with the “easy” entity categories. DATE WER ranged from 4.6% to 9.8%. TIME from 5.0% to 10.0%. ORDINAL from 4.3% to 8.6%. The pattern is clear: structured, pattern-based entities that follow predictable formats are manageable. The open-domain entities (names of people, organizations, and facilities) that financial analytics actually depend on are where accuracy collapses.
The ASR-NER Cascade: How Transcription Errors Compound Downstream
Entity extraction doesn’t happen in a vacuum. Most financial data platforms run NER models on transcript output to populate structured databases, tag entities for search, or feed analytics pipelines. The assumption is that if the transcript is “accurate enough,” the NER layer will handle the rest. The research says otherwise.
Szymański et al. (ACL 2023) studied this exact cascade in their paper “Why Aren’t We NER Yet?” and the findings are stark. Even on gold-standard, error-free transcripts of spontaneous speech, NER models fail to recognize 37% of entity spans. That’s the baseline on perfect input.
When ASR errors are introduced into entity spans, recognition rates crater. NER models correctly recognized only 18% of entities containing substitution errors. For insertion errors inside entity spans, recognition dropped to 6.8%. And for deletion errors (where the ASR model dropped tokens from within an entity), the NER recognition rate was 0%. Every single entity with a deletion error was missed.
This means the problem isn’t just that ASR models get entity tokens wrong at high rates. It’s that those errors propagate multiplicatively through downstream systems. A 40% entity WER at the transcription layer doesn’t produce a 40% miss rate in your entity extraction pipeline. It produces something worse, because NER models trained on clean text have no robustness to the specific error patterns ASR introduces.
Sector Variation and Domain Terminology Density
The Earnings-21 data also reveals meaningful variation across industry sectors. Technology sector WER ranged from 12.9% to 20.6% across models, while Industrial Goods ranged from 14.4% to 25.9%. The correlation is intuitive: sectors with denser specialized terminology push general-purpose ASR models further from their training distribution, producing higher error rates.
This matters for financial data platforms serving multi-sector client bases. A transcription vendor’s accuracy on a consumer staples earnings call tells you very little about their accuracy on a semiconductor or specialty chemicals call. The terminology density shifts, and with it, the entity error profile. Evaluating vendors on aggregate WER across a blended test set obscures exactly the sector-level variation that determines whether your clients can trust the output.
The Earnings-21 data makes the core point inescapable: a 5% headline WER can coexist with 40%+ entity WER on the tokens that drive financial analytics. The general-purpose ASR models that dominate the transcription vendor ecosystem weren’t built to prioritize entity accuracy in financial audio. They optimize for aggregate token-level performance, which means they optimize for getting common words right while systematically underperforming on the rare, high-value tokens that matter most. For any platform whose value proposition depends on accurate entity data flowing from transcripts into structured systems, headline WER isn’t just insufficient. It’s misleading.
Silence and Disfluency: Where Financial Audio Triggers ASR Hallucinations
The previous sections quantified hallucination rates and showed why WER misses them. But there’s a more fundamental question for anyone running a financial transcription pipeline: what causes hallucinations in the first place? The Careless Whisper data points to a clear answer, and it’s one that has direct implications for financial audio specifically.
Koenecke et al. found that audio segments producing hallucinations had meaningfully higher non-vocal duration shares: 29% of total duration, compared to 26% for non-hallucinating segments. That gap might look modest in percentage terms. But the logistic regression analysis confirmed that longer non-vocal durations are the single most significant predictor of hallucination occurrence (p<0.05). Silence isn’t just correlated with hallucinations. It’s the trigger.
This finding maps directly onto the acoustic profile of financial audio. Earnings call Q&A sessions contain extended pauses between questions as analysts wait for operator cues. Expert network interviews feature long silences when the expert pauses to formulate a careful answer to a sensitive question. Multi-speaker calls produce dead air during handoffs between presenters. These aren’t unusual conditions. They’re the standard operating environment for the audio that financial data platforms process every day.
Non-Speech Audio and the Training Data Bias Problem
Research from Barański et al. (2025) on non-speech hallucination patterns sharpens this picture considerably. When the researchers fed pure non-speech audio inputs into ASR models, 40.3% of those inputs produced hallucinated output. The model didn’t return silence or an empty transcript. It fabricated text.
The content of those fabrications is revealing. The most common hallucinated phrases were “thank you for watching,” “thanks for watching,” and “subtitles by the amara.org community.” These aren’t random strings. They’re artifacts of training data bias. Models trained heavily on YouTube transcription corpora have internalized the structural patterns of web video (outros, subscription prompts, attribution text) as high-probability sequences. When the acoustic signal disappears, the decoder falls back on these priors and generates the text it’s been trained to expect after silence.
In a YouTube transcription context, this is an annoyance. In a financial transcript, it’s a data integrity problem. A phrase like “thank you for watching” appearing mid-transcript during what was actually a 15-second pause in an earnings Q&A doesn’t just look wrong to a human reader. It’s a fabricated text segment that downstream NLP systems will parse, index, and potentially attribute to a speaker. The hallucination enters the structured data layer as if someone actually said it.
Duration Thresholds and the 30-Second Decoding Window
The Barański et al. research also identified a critical duration dependency. Hallucination rates rise sharply for audio segments exceeding 30 seconds, with 62.3% of 30-second non-speech segments producing hallucinations. This threshold isn’t arbitrary. It corresponds to the standard decoding window used by Whisper and similar models. When a 30-second chunk contains little or no speech, the decoder has an entire window’s worth of generation capacity with minimal acoustic grounding. The language model fills the void.
Financial calls routinely contain silence segments in this range. A two-minute break between prepared remarks and Q&A. A 45-second pause while a company’s legal counsel reviews a question before allowing the CFO to respond. A technical delay on a conference bridge. These are normal features of the audio that transcription vendors process at scale. And they’re precisely the segments where the ASR model is most likely to fabricate content.
Distribution Shift: Why Financial Audio Amplifies the Problem
The silence trigger doesn’t operate in isolation. Atwany et al.'s Lost in Transcription paper (2025) demonstrated that Hallucination Error Rate correlates with distribution shift from training data, measured by Central Moment Discrepancy (CMD), at α=0.91. That’s a near-linear relationship. The further the target audio sits from the model’s training distribution, the more hallucinations it produces.
Financial audio represents a significant distribution shift on multiple axes simultaneously. The vocabulary is domain-specific (ticker symbols, structured product names, regulatory terminology). The speaker population includes multi-accent executives on compressed conference call lines with varying sample rates. The acoustic conditions (VoIP compression, speakerphone artifacts, multi-party bridge connections) differ substantially from the clean, close-mic recordings that dominate web-crawled training corpora.
Each of these factors individually pushes the model further from its training distribution. Combined, they create conditions where the encoder’s acoustic representations are weaker, the decoder’s language model priors are less calibrated to the actual domain, and the probability of hallucination rises accordingly. The near-linear correlation Atwany et al. documented means this isn’t a vague directional concern. It’s a quantifiable, predictable increase in hallucination rate that tracks with domain distance.
For financial data platforms, the implication is structural. The transcription vendor ecosystem’s reliance on general-purpose ASR models means the models processing your audio are, by definition, operating at a distribution shift from their training data. That shift is highest during the exact segments (silence, disfluent speech, domain-dense terminology) where accuracy matters most. The silence problem and the domain problem aren’t separate issues. They compound.
What to Measure When Evaluating a Transcription Vendor for Financial Data
The previous sections have made the case with published data: WER undercounts hallucinations, fluency checks can’t catch them, and entity-level accuracy on financial audio is 2x to 4x worse than headline numbers suggest. The natural follow-up question for any Head of Data or Head of Engineering is practical. If WER isn’t sufficient, what should you actually measure?
Here are four metrics that, taken together, give a materially more complete picture of transcription quality for financial use cases. No single metric replaces WER entirely. But any vendor that can’t report on these dimensions is offering you an incomplete accuracy claim for the domain you operate in.
1. Entity-Level Accuracy on Financial Terms
Measure WER separately for organization names, person names, financial figures, and ticker symbols. Don’t accept a blended number. The Earnings-21 benchmark showed that PERSON entity WER ranged from 42.1% to 51.7% and ORG entity WER from 31.4% to 44.3%, even when headline WER for the same models on the same audio sat between 11.3% and 17.8%. That’s a 3x to 4x gap between what the headline number reports and what’s actually happening on the tokens your downstream systems depend on.
The right approach is to build a tagged evaluation set from your own audio. Pull 50 to 100 representative segments, annotate the entity spans manually, and score entity WER independently. If entity WER is 3x or worse than the vendor’s headline claim, the headline number is masking the failure modes that matter for your pipeline.
2. Hallucination Rate on Silence Segments
Isolate segments containing more than three seconds of silence or non-speech audio and measure what fraction produce fabricated text. This is the metric most transcription vendors simply can’t report, because they’ve never tested for it.
The research justifies this test directly. Barański et al. found that 40.3% of pure non-speech audio inputs produced hallucinated output, rising to 62.3% for 30-second non-speech segments. Financial audio is full of these conditions: Q&A pauses, bridge hold periods, speaker handoffs. If a vendor can’t run this test on your evaluation set, they have no visibility into their hallucination rate on the audio conditions your platform encounters daily.
3. Numerical Precision Rate
Measure accuracy specifically on financial figures: basis points, percentages, dollar amounts, share counts, and growth rates. A single numerical error in an earnings transcript (reporting “fifteen percent” when the speaker said “fifty percent”) can be more consequential for downstream analytics than dozens of filler-word mistakes.
This metric doesn’t require a complex setup. Tag the numerical tokens in your evaluation set, score them separately, and calculate precision on that subset. The Earnings-21 data showed that structured numerical entities like dates and ordinals had relatively manageable error rates (DATE WER from 4.6% to 9.8%), but less structured figures embedded in financial commentary don’t follow predictable patterns and are more susceptible to substitution errors. Your evaluation should reflect the specific numerical formats your clients’ analytics consume.
4. False-Positive Speaker Attribution Rate
Measure how often statements are attributed to the wrong speaker. In an earnings call transcript, a CEO’s forward-looking guidance attributed to an analyst (or an analyst’s question attributed to the CFO) corrupts sentiment analysis, executive-level analytics, and any model trained on speaker-role-segmented data.
Speaker diarization errors compound with transcription errors. If the ASR model misattributes a segment and also introduces entity or numerical errors within that segment, the downstream damage is multiplicative. Score attribution accuracy on your evaluation set by comparing predicted speaker labels against ground truth for each segment.
Building a Finance-Specific Evaluation Framework
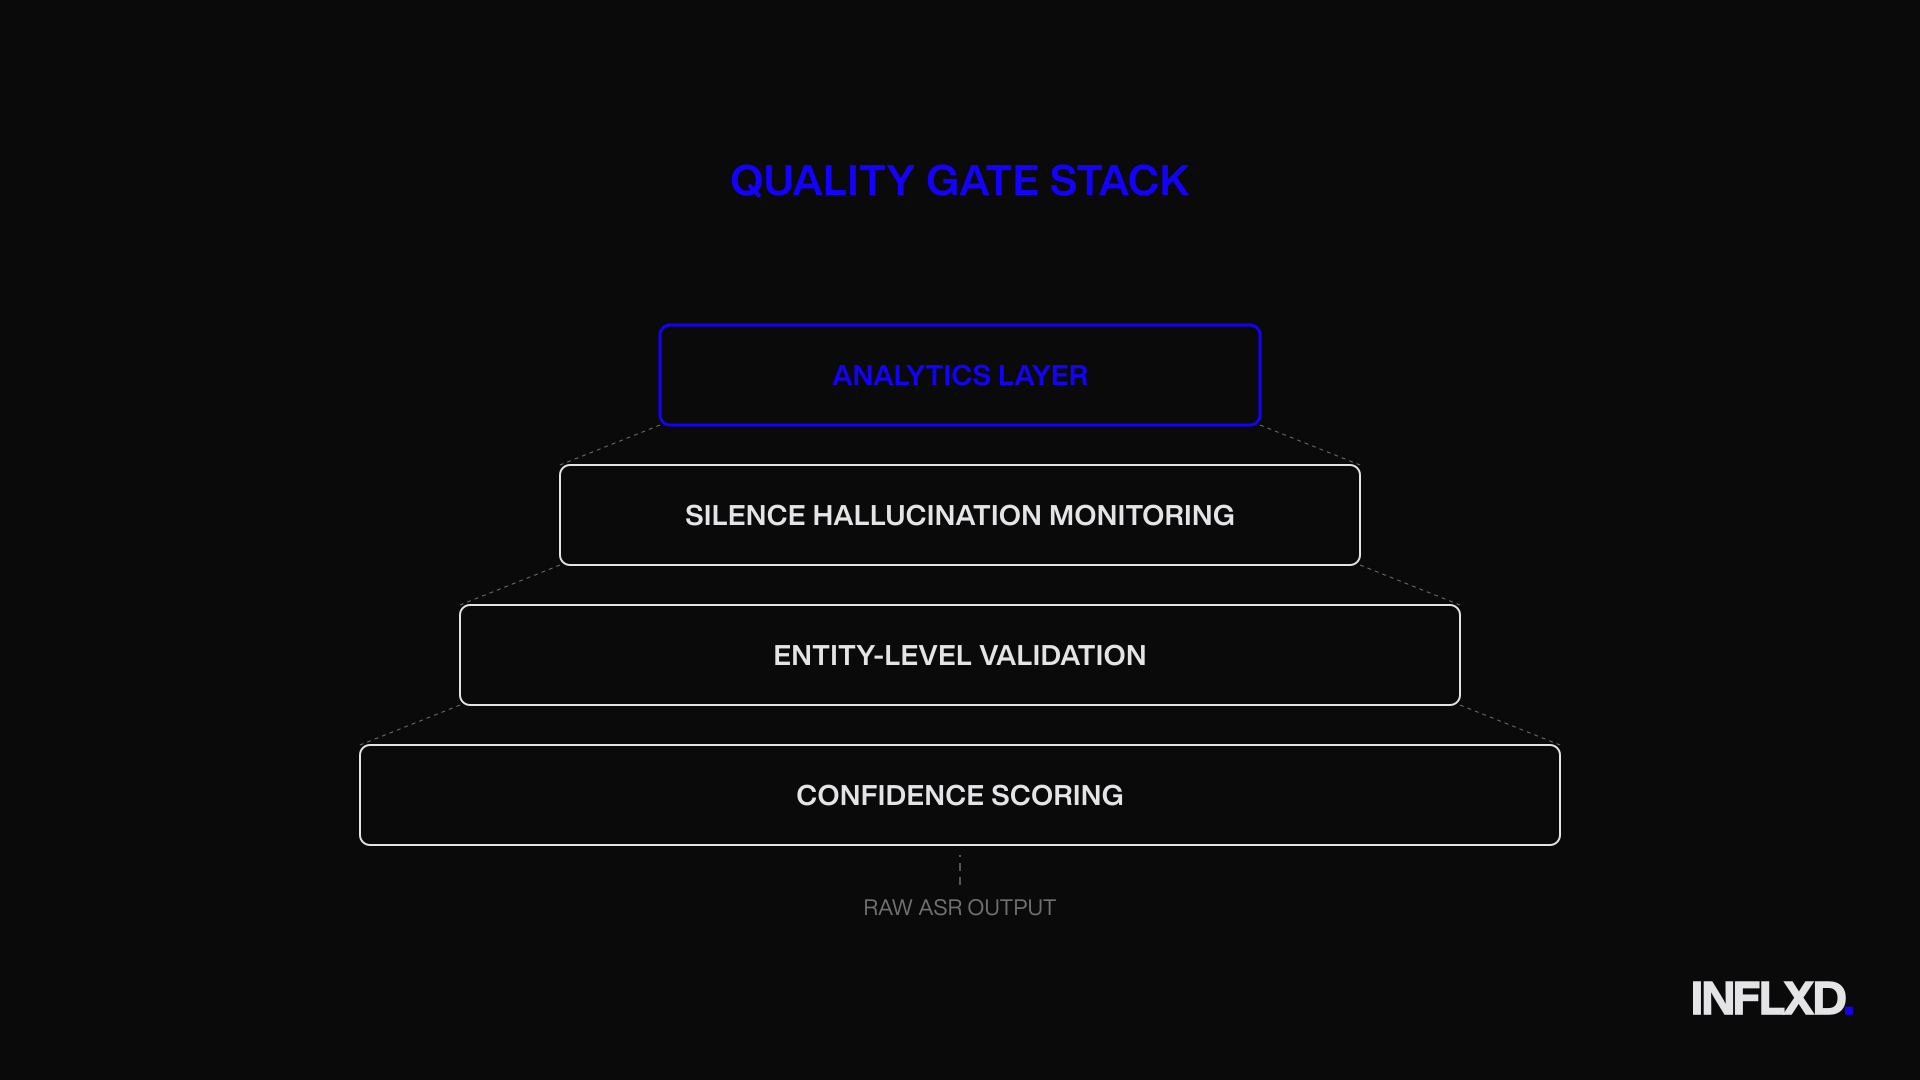
These four metrics together address the specific failure modes that WER alone misses: entity accuracy captures domain vocabulary performance, silence hallucination rate captures fabrication risk, numerical precision captures the highest-consequence substitution errors, and speaker attribution captures structural integrity of the transcript.
The absence of a standardized evaluation framework for finance-specific audio isn’t a failing of any individual financial data platform. It’s an industry gap. The transcription vendor ecosystem hasn’t built the tooling to measure what matters for this domain, because general-purpose benchmarks don’t require it. Vendors optimizing for WER on broad datasets have no incentive to report entity-level breakdowns or silence hallucination rates unless their clients demand it.
That’s the leverage point. If your vendor evaluation process includes these four dimensions, you’re no longer relying on a single number that was designed for a different purpose. You’re measuring what actually determines whether your transcripts are safe for downstream financial analytics. And you’re creating market pressure for the vendor ecosystem to build the domain-specific quality infrastructure that financial data has always required.
Confidence Scoring and Downstream Analytics: Protecting Financial Transcript Integrity
The previous section laid out what to measure. This section addresses what happens after measurement: how confidence scoring can serve as a runtime quality gate that catches high-risk transcript segments before they enter your analytics pipeline.
The core idea is straightforward. ASR models don’t just produce text. They produce text with associated confidence scores, token-level probability estimates reflecting how certain the model is about each predicted word. In theory, low-confidence tokens should correlate with errors, giving you a signal to flag segments for human review. In practice, the relationship is real but more complicated than it appears.
The LSEG Research: Confidence Labels for Financial Event Transcription
The most directly relevant work here comes from LSEG (London Stock Exchange Group), which published research on using aggregated ASR confidence scores to classify financial event transcripts into quality tiers. Their findings confirm the basic premise: there’s a negative correlation between aggregated confidence scores and error rates (both WER and CER) at the document level. Transcripts where the model was less confident did, in fact, contain more errors.
More importantly, LSEG demonstrated that these aggregated scores could be abstracted into categorical labels (high, medium, and low confidence) with 90% classification accuracy. That’s a practically useful result. It means a financial data platform can automatically triage incoming transcripts, routing low-confidence documents to human review rather than treating all ASR output as equally reliable. For hallucination risk specifically, this matters because hallucinated segments often exhibit anomalous confidence patterns that differ from standard phonetic errors.
The Overconfidence Problem: Why Raw Scores Mislead
Here’s where the nuance gets important. Deep neural network ASR systems tend to produce overconfident scores, particularly after n-best pruning steps in the decoding process. LSEG’s research found that incorrectly hypothesized words still carried mean confidence scores between 0.71 and 0.88. That’s a problem. A token-level confidence threshold set at, say, 0.70 would pass the vast majority of errors without flagging them.
This overconfidence is why raw confidence scores can’t be used as direct probability estimates. A score of 0.85 doesn’t mean there’s an 85% chance the word is correct. It means the model’s internal scoring mechanism assigned that value, and the model’s internal scoring mechanism is systematically miscalibrated toward certainty. The LSEG approach of abstracting scores into categorical labels rather than relying on raw thresholds is a direct response to this calibration gap.
Confidence-Aware Pipelines as a Quality Architecture
The practical takeaway isn’t that confidence scoring solves the hallucination problem. It doesn’t. But it adds a layer of risk stratification that’s absent from most transcription vendor pipelines today. A mature financial transcription architecture doesn’t treat ASR output as a finished product. It uses confidence measures, entity-level validation (as discussed in Section 6), and silence-segment monitoring as sequential quality gates before transcripts enter the analytics layer.
This is the direction the industry’s moving. The tooling for confidence-aware transcript pipelines exists. The research validating the approach in financial contexts is published. The question for Heads of Data and Engineering isn’t whether this architecture makes sense. It’s whether your current vendor ecosystem provides the confidence metadata, entity-level accuracy reporting, and hallucination detection infrastructure needed to build it. Most general-purpose transcription vendors don’t expose token-level confidence data to clients at all, let alone calibrated or categorized versions of it. That’s not a gap in your team’s capabilities. It’s a gap in what the vendor ecosystem has prioritized building.
Building a Reliable Financial Transcription Pipeline: Where INFLXD Fits
The benchmark data across this piece tells a consistent story. AI hallucinations in financial transcripts aren’t rare, random, or unpredictable. They’re measurable, systematic, and concentrated in exactly the segments that matter most for downstream analytics. They cluster around silence and disfluency. They disproportionately affect entity-dense tokens (person names, organization names, financial figures) where the Earnings-21 data shows error rates 2x to 4x worse than headline WER. And they’re invisible to the evaluation frameworks that most transcription vendors report against.
WER doesn’t catch them. Fluency scoring actively misses them. Confidence scores, while useful for triage, are systematically overconfident on the very tokens that are wrong. The failure isn’t in any single metric. It’s in treating any single metric as sufficient for a domain this demanding.
What INFLXD Brings to Financial Speech-to-Text
INFLXD doesn’t claim zero hallucinations or perfect accuracy. No honest provider can. What INFLXD brings is a measurement and quality framework built around the failure modes the research documents.
That means entity-level accuracy measurement on financial terminology, not blended WER across an entire transcript. It means monitoring silence-segment behavior, because the Careless Whisper and Barański et al. research confirmed that silence is the primary hallucination trigger and financial audio is full of it. It means domain-specific quality controls calibrated for the acoustic and linguistic conditions of earnings calls, expert interviews, and multi-speaker financial events. The value isn’t in claiming the problem doesn’t exist. It’s in knowing where it occurs and building the pipeline to catch it before it reaches your clients’ analytics.
A Practical Next Step
If you’re running a financial data platform, here’s the most useful thing you can do this quarter: take the four-metric evaluation framework from Section 6 (entity-level accuracy, silence hallucination rate, numerical precision, speaker attribution) and run it against your current vendor’s output on a representative sample of your own audio. The results will tell you whether your headline accuracy numbers reflect what’s actually happening on the tokens your pipeline depends on.
If gaps appear, that’s the starting point for a conversation about what a finance-specific transcription pipeline should look like. The failure modes are documented. The evaluation framework exists. The remaining question is whether your current vendor ecosystem is measuring what matters.
The Real Cost of AI Hallucinations in Financial Transcripts: What to Do Next
The benchmark data doesn’t leave much room for ambiguity. AI hallucinations in financial transcripts are systematic, measurable, and concentrated in the exact segments that carry the most analytical weight. They cluster around silence and disfluency. They target named entities, numerical values, and speaker transitions. And they pass through traditional QA undetected because WER wasn’t designed to catch them and fluency-based checks actively reward them.
Here’s what the published research makes clear:
- Hallucinations aren’t rare. Roughly 1 to 1.4% of ASR segments contain fabricated content, and 38% of those hallucinations are harmful. At production scale, that’s thousands of corrupted segments per quarter.
- The tokens that matter most fail most often. Entity-level WER on organizations, person names, and facilities runs 2x to 4x worse than headline WER. Financial terminology is precisely where generic ASR models break down.
- WER can’t distinguish between a minor substitution and a fully invented sentence. Without hallucination error rate (HER) as a separate metric, you’re flying blind on the failure mode that poses the greatest risk to downstream analytics.
- Vendor accuracy claims are incomplete if they can’t report entity-level precision, hallucination rate on silence, numerical accuracy, and speaker attribution error. These aren’t aspirational metrics. They’re table stakes for any pipeline feeding financial decision-making.
The gap between published WER benchmarks and production reliability on financial audio isn’t closing on its own. It requires domain-specific measurement, targeted human review where confidence is low, and a QA framework built around the failure modes that actually matter.
INFLXD builds transcript quality infrastructure for expert networks and financial data platforms. If you want to see where your current pipeline’s accuracy claims hold up and where they don’t, run a sample through INFLXD’s transcript benchmarking process. No pitch deck. Just data on the metrics your vendors aren’t reporting.